Sharing Reports
Most reports are a collection of one or more questions.
To share them with others, you must add them to a dashboard in Metabase, which will surface as Report in Projectworks.
Create new Dashboard
-
To create a new dashboard, access Metabase through the ‘Add Custom Report’ button.
-
Then select the +New button on the right hand side and select ‘Dashboard’ from the menu options
-
Name your dashboard, add a description and add it to your personal collection and click ‘create’

You can now add previously created charts/questions to the dashboard. -
Select ‘Add a chart’ and select one from your collection. You can edit the size and placement of the chart until it suits your liking.
-
Drag the dashboard from your personal collection to the [Tenant Name] collection
Only Dashboards in the Tenant Collection can be made visible to others in Projectworks via the Manage Reports function
Add to existing Dashboard
-
To edit existing dashboard, access Metabase through the ‘Add Custom Report’ button.
-
Next expand the burger menu on the left hand side and select Tenant Collection and any of the existing dashboards.
-
Wait for it to open and access edit mode through the pencil icon on the top ribbon.
-
Use the new + icon on the ribbon to add a new chart you to the dashboard.
-
Save.
Add filters to dashboard
While we are able to filter results while creating any individual chart/question, users who can only view the report cannot. To address this, we can add filters to a dashboard. These filters will be visible to the end users and allow them to filter data to suit their needs.
-
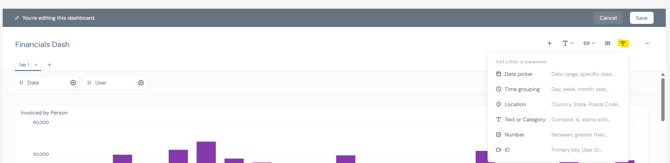
Navigate to any existing dashboard (either one you’ve just created or one you’ve created previously) and make sure you are in the edit mode (as indicated by the grey top ribbon).
-
Select the funnel icon and list of filter options will appear. In this example we are using Date picker and Text or Category
-
First, add a Date Picker filter. You will need to connect it to the individual charts/questions to define which date field it will be considering. For example here we will use the ‘Date’ column in the Time Entry table to find which date the time entry applies to.
-
Then add Text or Category filter to allow the charts/questions to be filtered by user.
-
Change the filter name to User so that you remember what it’s purpose is,
-
Then Connect the filter to any report that includes users.
-
Make sure the dropdown list contains the expected list of values - it should pull the list form the field you connected the filter to.
-
Save your changes.
When you return to ‘Back to all reports’ and select the report/dashboard in Projectworks, you’ll see the two filters against the dashboard and can filter the dashboard data with them.
The filters stack, so if you choose a time period AND user the system will return results for the select user in the select time period.
Download Data
Users can download data from reports/dashes in two ways;
-
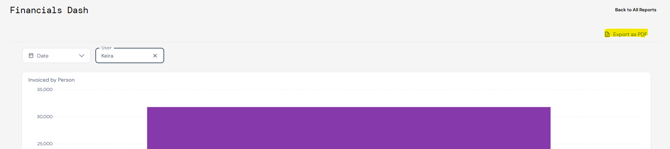
The entire report as a PDF
-
Navigate to the report and select ‘Export as PDF’
-
-
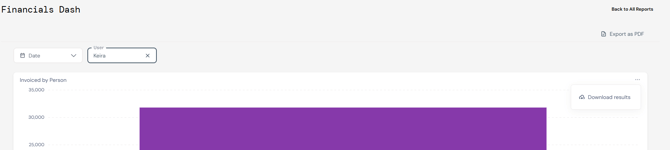
Individual charts/questions.
-
Navigate to the report, hover over the top right corner of any individual chart click on the three dot icon that appears and select ‘Down results’.
-
-
A new menu will appear to allow you to select which format to download that individual chart results.
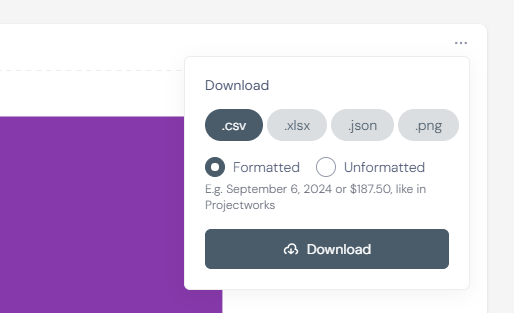
The result output will respect the filters that are on and will only include results that meet the filters - exactly as you see on the UI.
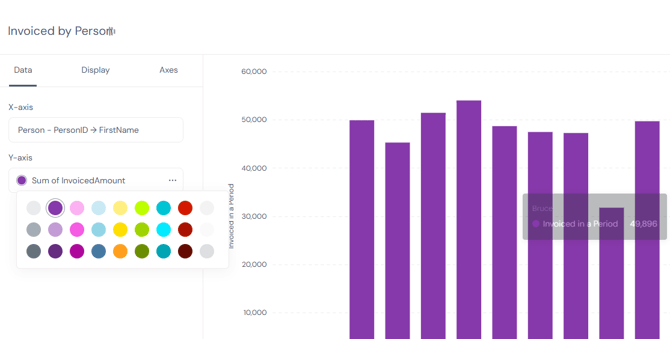
🖌️Editing Report Visuals
You can edit the colors and labels for charts to get a more custom look and feel.
-
Navigate for a chart/question of your choice in Metabase and select the cog icon.
-
By clicking on the color dots next the the Y-Axis values you can change the color on the chart
-
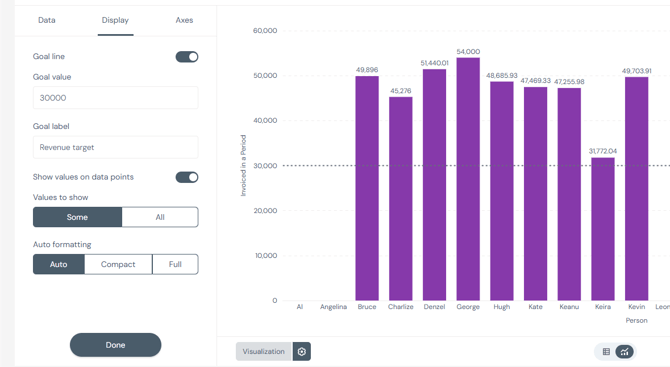
Navigating to the ‘Display’ tab you can choose to show a Goal line for the chart as well as the values on data points
-
Navigating to the Axes tab you can adjust the chart labels